Solar panel thermography: how to prioritize hotspots
Solar panel thermography is one of the fastest ways to find invisible losses in photovoltaic plants. But a thermal image only creates value when the team can answer three questions: what anomaly exists, how severe it is and which action should enter the O&M routine first.
This matters because not every hotspot requires the same response. A heated cell, localized soiling, temporary shade and an electrical failure can all appear as temperature differences. The report needs to separate operational signal from visual noise.
What thermography actually shows
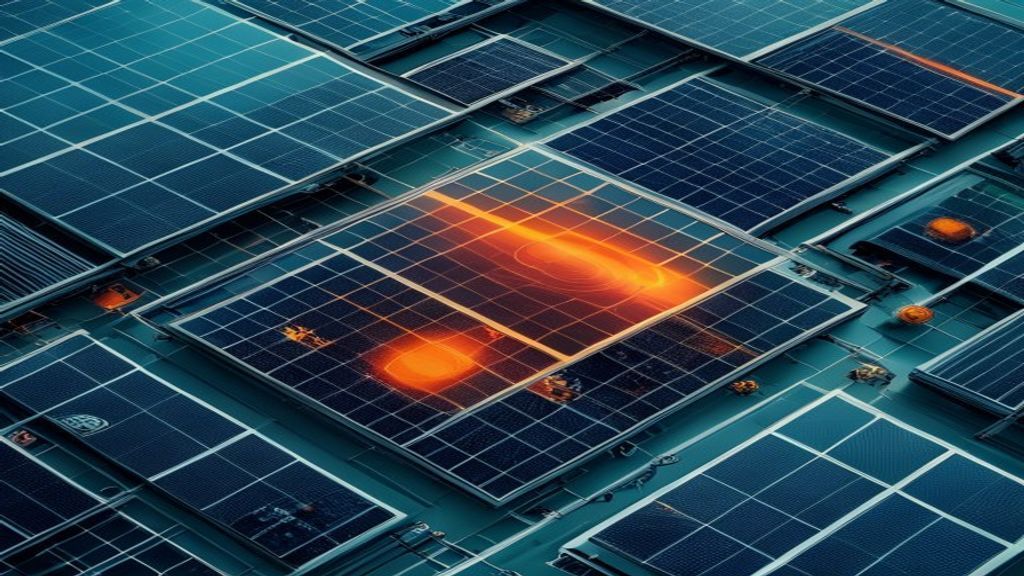
A thermal camera records temperature differences on the surface of modules. In photovoltaic thermographic inspection, those differences help identify heated cells, abnormal bypass diode behavior, possible mismatch, soiling, shading, cracks with electrical impact and connection failures.
The analysis should consider irradiance, wind, time of day, capture angle, emissivity, system load and comparison with neighboring modules. Without that context, solar panel thermography can overestimate simple issues or underestimate anomalies with real impact.
How to prioritize hotspots
Prioritization starts with thermal delta, but it does not end there. A small hotspot can be relevant if it repeats in the same string. A strong heat signature can be lower priority if it is clearly associated with soiling and has no recurrence. Classification should combine severity, pattern and electrical context.
- Compare the module with neighbors under the same irradiance conditions.
- Classify whether the pattern suggests a cell, module, string, soiling, shade or physical damage.
- Cross-check the event with inverter, string, alarm and generation history.
- Separate immediate action, field verification, cleaning and monitoring.
- Record classification confidence to avoid false precision.
Field example
Imagine a plant with 70 hotspots found in one flight. Twenty are concentrated in two strings from the same inverter, ten are associated with nearby vegetation, fifteen appear on dirty modules close to a road and the rest are dispersed. Treating everything as module replacement would be expensive and imprecise.
With a severity queue, the team investigates the concentrated strings first, schedules cleaning in the soiled sector, corrects vegetation where there is shade and monitors the dispersed cases. The gain is not only detecting photovoltaic module anomalies, but reducing decision time.
Report quality checklist
- Does the report show thermal and RGB images of the same point?
- Does each anomaly have type, severity and operational location?
- Was the hotspot compared with neighboring modules?
- Is there a likely cause and a recommended next action?
- Is the list ordered by O&M priority?
- Was the history of previous inspections considered?
ZenVision organizes this process so thermography moves from a drone flight into an actionable plan for the operations team. For solar plants, the difference between image and decision is also where SEO finds substance: technical content that is useful and tied to real field problems.